Air pollution, specifically particulate matter 2.5, can vary significantly over space and time. Although the EPA’s AirNow system is good in the sense that it has highly accurate monitors and releases the data hourly to the public, I was dissatisfied with its coverage in my area, the greater Boston area. There are 5 monitors that provide data to 4.7 million people… not very granular! Furthermore, this data is pretty impersonal- these monitors are not located in publicly visible places, and simply reporting an air quality value for a massive area is not going to make it feel very real to people after considering that air pollution is not in a high enough concentration to be visible here 95% of days.
So, I wanted to bring air pollution data down to a very human level so the average Boston resident could understand its relevance to their lives. My requirements for the monitor were:
- A technology that was proven accurate in independent testing for a reasonable price
- Live streaming to the web via Wi-fi for ease of sharing the data
- Weatherproof down to 0 degrees Fahrenheit, able to withstand the Massachusetts winter
- Power and internet demands that were easily available in the US
- Minimal maintenance for ease of use by end-user
- 100% uptime, no interruptions in service by device.
The following instructions show how I built V1 for approximately $500. I settled on creating a system based around the following 3 technologies:
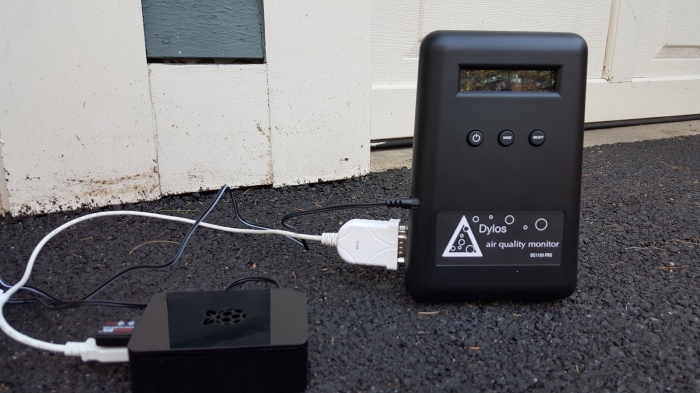
- Dylos DC 1100 Pro with PC interface (link)
- CanaKit Raspberry Pi w/ Wi-Fi (link)
- Primex P1000 weatherproof case (link)
Other things you will need:
-Reflectix Insulation (link)
-Velcro adhesives (link)
-Zipties
-Incandescent rope lights for heating (link)
-Trendnet Serial to USB cable (link)
-3 Way Wall Outlet Plug Adapter (link)
-Scissors
-Box cutter
And it looks like this:

Here are 4 key resources I consulted to make this:
- Drexel senior design project, outdoor Dylos system (link)
- WorldAQI Build Your Own Wi-Fi Enabled Dylos Monitor (link)
- Outdoor Cat Enclosure, heated and insulated for cheap (link)
- Accuracy testing for Dylos monitor (link1)(link2)(link3)
Live experiment streaming currently at joinvivergy.com/schools
The heating method is needed for proper functionality of the Dylos. In order for the Dylos to read accurately, it needs to be at a temp above 32 degrees Fahrenheit, I aim for 40 degrees to be safe.
Part 1: Connecting Raspberry Pi to Dylos/ Wi-Fi Enabled
- Set up your Raspberry Pi with Raspbian OS, as provided
- Connect your Raspberry Pi to the Dylos with the Serial to USB cable.
- Download the PHP scripts from the WorldAQI project (link) to the Pi and follow included instructions. You are also going to want to set it up so that they run on startup of the Pi, instructions at that link as well. Furthermore, you may want to stream the results to your personal server if you want to manipulate the data yourself. Check line 82 of /dylos.php to change to destination of data.
Finished picture:
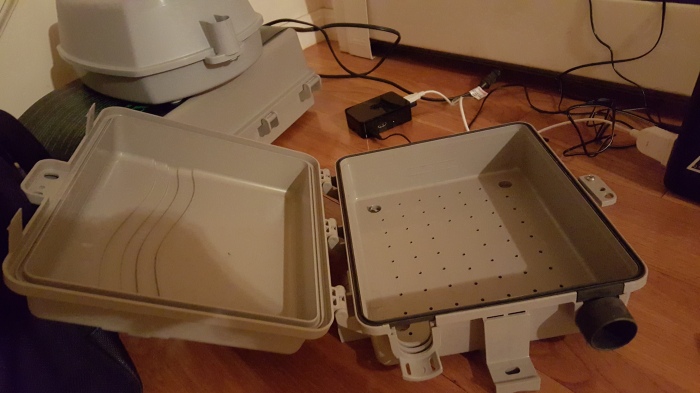
Part 2: Setting Up the Enclosure
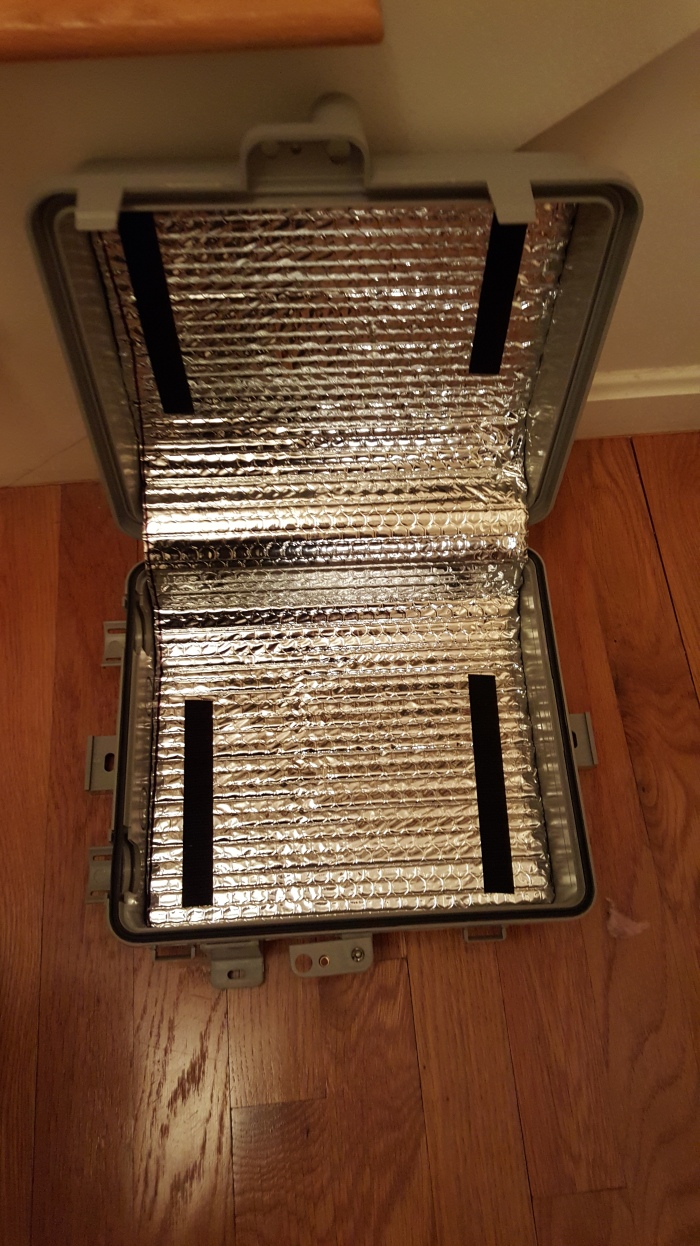
Start by lining your Primex P1000 with insulation, attached with Velcro.
Bare enclosure
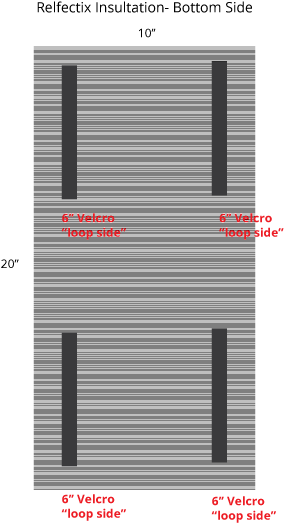
Plan for velcro on Primex

And Reflectix Insulation
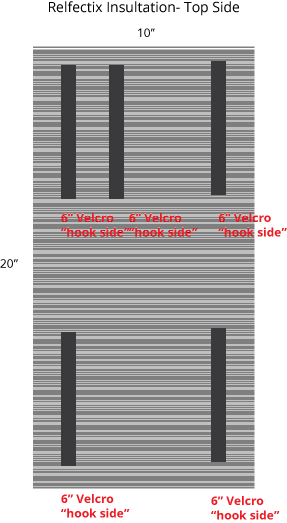
Finished picture with velcro attached (minus second strip of velcro for attaching incandescent lights
Part 3: Assembling pieces within enclosure
First, the lighting/heating. Coil the incandescent rope light into a loop that fits on the left side of enclosure, then use a zip tie to hold the form. Use two loops of Velcro to attach to the top, the attach to the two lines of Velcro “hooks” on top.
Diagram

Pic

Second, everything else. It is going to be a tight fit. You need to add one strip of Velcro “loop” side along the bottom of the Pi, then one strip “loop” side at the top of the Dylos and one at the bottom.
Diagram

Pic

Make sure to remember to turn the Dylos on before putting it in place!
Got any questions/comments? Would love to hear ’em. Leave a comment or reach me at kevin (at) joinvivergy (dot) com.
